Layton ServiceDesk - System Access and Menu
As discussed in the System Access and Menu Structure section, there are two types of system access accounts: Analyst and End User. The Analyst has a heightened level of security or system access which depends on the Manage Analyst Security Group setting. This setting is set to either Administrator or Standard where the Administrator Menu item will be made available to Administrator Analysts. There are two main types of forms in Administration. When creating or editing data, there is usually a Save button (![]() ) available which must be used to commit any changes. There are some settings pages with no Save button, for example Email Settings & Bodies and Form Design. Changes made in these areas are live so all changes will have an immediate effect on the system and its users.
) available which must be used to commit any changes. There are some settings pages with no Save button, for example Email Settings & Bodies and Form Design. Changes made in these areas are live so all changes will have an immediate effect on the system and its users.
Contents |
Login Page
After opening the Layton ServiceDesk™ web application, you will be presented with the Login screen, where the type of system access is selected, either Analyst or End user. In this case, we will choose the Analyst Login and login with an Analyst username and password.
The login screen is also configurable, so for example, if your ServiceDesk does not require End User access, you disable it by setting Allow End User Login to Off in Administration > Security > General Security. With this setting turned off, the End user login option become unavailable. End Users may register themselves when first accessing the system, and this facility may also be removed in Administration > Security > Global End User Security by enabling Allow End User Self Registration.
If this is your first time logging in, or you have not already setup any system administrators, then you must use the default login credentials:
Username: admin
Password: mib
Analyst Menu
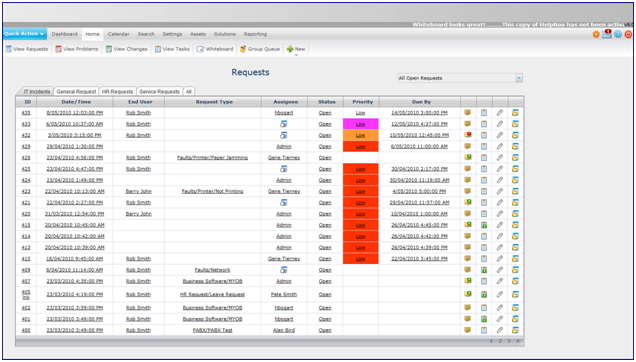
When accessing Layton ServiceDesk™ as an Analyst, you will be presented with the menu structure at the top of the screen and your Home screen, or view, as specified in your Analyst Settings. Otherwise, you will see the system default screen, which is My Assigned Requests, or Requests that have been assigned to you. The example below shows the Menu structure and a sample list view of All Open Requests.
The Request List View filter is the drop-down menu on the top-right above the table of Requests. This may be used to quickly view a different group of requests, such as Unassigned Requests.
The main Analyst activities are grouped under the Home menu item. This is where all new Requests, Tasks, Problems and Changes are logged and existing ones viewed, amended, and progressed. The following sections define the activities of the Menu but in order of Layton ServiceDesk™ functions and not Menu order.
Whiteboard
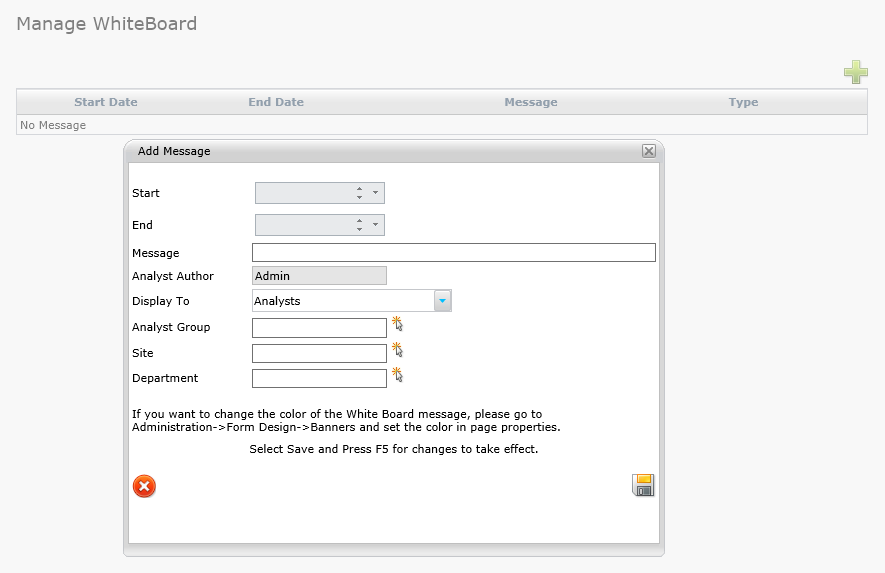
The Whiteboard allows an Analyst to place messages as a scrolling ticker in the banner at the top of the screen. It is controlled in Manage Whiteboard panel:
If there are existing Whiteboard messages, they may be edited by clicking on them. New messages are added by clicking the Add New icon (File:Addplus.png), which displays the Add Message dialog:
For a Whiteboard message to display properly, you must specify a Start and End date to schedule the message display time and the message itself. All other fields are optional to control the visibility of the Whiteboard message. The Analyst Author is automatically populated with the username of the Analyst creating the Whiteboard message. This is the only Analyst who will have access to modify or delete the message once it has been created. The Display To option default it set so that the message is only visible to Analysts. If the message is intended for End Users, the Display To option may be set to End Users and Analysts. If the message should be visible only to Analysts, the Private setting should be used. There are also filters that allow you to post Whiteboard messages that are only visible to specific Analyst Groups, Sites, and Departments. As instructed in the dialog, the color of the message can be modified in the
Analyst Group Queues
The Analyst Group Queues display the current number of Assigned and Unassigned requests for each Analyst Group. If the Problem & Change Management feature has been enabled then there will be columns displaying the number of Assigned and Unassigned Problems & Changes for each Analyst Group.


