Layton ServiceDesk - Reporting - Creating Custom Reports
![]() Previous article in this series: Reporting Overview
Previous article in this series: Reporting Overview
Contents |
Overview
Custom reports can be configured to output data in grids, a rows-and-columns arrangement of data. Statistics reports cannot be created as custom reports.
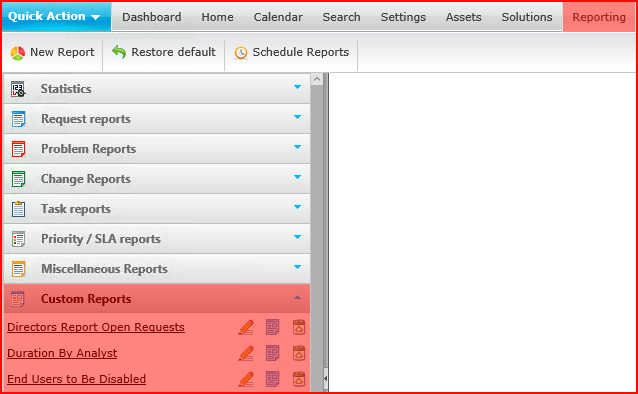
By default, custom reports appear in the Custom Reports category, but they can be relocated to any category except Statistics.

Procedure
In the Reporting tab, click the New Report button
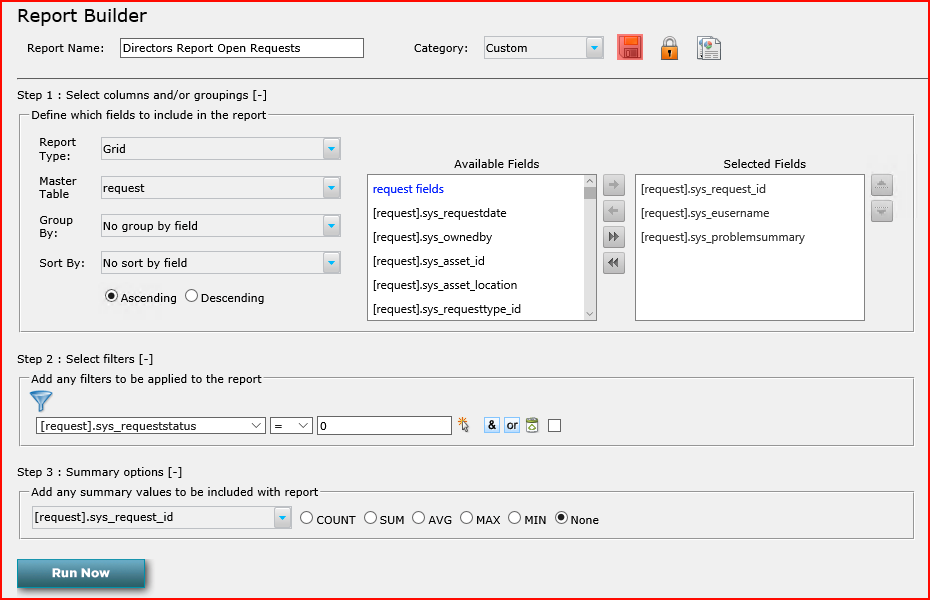
Naming and Categorization
Report Name
Give the report a name
Category
Select the report category. The report categories are displayed in the left hand panel of the reports page and the reports are sorted alphabetically within each category. You can move reports to different categories, simply by changing the Category they are saved in from the drop down list.
Step 1: Select Columns and/or Groupings
Select the type of report you and the available options are Grid, Pie Chart, Column Chart and Trend Chart. If you select a Chart type as your option, there is an additional check box so you can add the data grid to also be displayed. See Creating Charts for details.
Select the report master table from the drop down list. The drop down list will display all of the tables in the database. The most common reports will involve Requests, Problems, Changes & Tasks and the relevant master tables for these reports are listed below.
| To Report on | Select this Master Table |
|---|---|
| Requests | request |
| Problems | problem |
| Changes | change |
| Tasks | action |
The next step is to select the data fields that are to be displayed in the report. There are two windows on the page showing the list of available fields in the left hand window and the selected fields are displayed in the right hand window. By default the available fields window will display all of the fields from the master table. The database table to which the available fields belong is indicated by the text at the top of the list which is highlighted in blue. For example, if you have selected the request master table, it will display request fields at the top of the list. All of the fields in the request table will be displayed and each field will be prefixed with [request] indicating that the field is from the request table.

To add fields to the grid report, highlight the required fields (you can multi-select fields) in the available fields window and then either drag and drop the fields into the selected fields window or use the arrows between the two windows to move the fields back and forth.
In addition to adding fields from the master table you can also add fields from other linked tables where there is a link via a foreign key in the master table. For example the sys_eusername (End User) field is a foreign key in the request table and the primary key in the euser (End user) table. This will allow you to add fields from the euser table such as the end user's forename ( [euser].sys_forename ) into your report.
Any foreign key fields in the master table will be displayed at the bottom of the list of available fields and will be indicated by their green color, eg. sys_eusername.
To view the fields in this linked table double click on the green field and the fields from the linked table will now be available for selection. The new table name will be highlighted in blue underneath the master table name at the top of the list and the new fields will be prefixed with their table name. e.g [euser].sys_forename.
To return back to the list of the master table fields, double-click on the blue text of the master table, e.g. request fields.
Once you have selected the fields for the grid report, if you wish to group the data by a particular field you can do this by selecting the field from the Group By drop down list. Please note that reports can also be grouped, sorted and filtered on the fly after the report has been generated.
Step 2: Select Filters

After the fields have been selected filters can be applied by clicking on the filter icon. A drop down list will appear which contains a list of the fields from the master table. This list works in the same manner as the available fields window as described above, allowing you to drill down to linked tables.
Once a filter field has been selected the filter operator options will be available for selection. The filter operators will be determined by the type of data field that has been selected. For example if the field is an integer field the operator values will include =,<, >, >=, etc. For variable character or text fields the operator values will include; starts with, ends with, contains, is, is not, etc. Date fields operators include; on/within, before, after, between.
For date filters there is also a pre-populated list of values available such as Today, Last Week, Last Month, Next Month, Next 60 days etc. These options are particularly useful when you want to schedule reports. For example you can schedule a report to show you all high priority requests logged in the past 30 days. This report can be automatically generated on the 1st of the month and be sent via email.
Once the operator has been selected the value can entered. There is a small search icon next to the value field and selecting the search option will display a drop down list of all values for this field that are in the database. Clicking on the search icon a second time will remove the drop down list and display the manual entry field. If a date filter field has been selected there will be a select icon which will pop up a calendar window where you can select a date.
Multiple filters can be added by clicking the And or Or buttons.
Custom Filter Label
By checking the checkbox next to the Delete button ![]() , a custom label for the date range can be entered.
, a custom label for the date range can be entered.

When the report is run, this will appear:

Step 3: Summary Options
Summary values can be added to any fields in the grid report by selecting the field in the summary options drop down list. Integer fields will have summary options for Count, Sum, Average, Max & Min. Date/Time and variable character fields will only have the Count option. Summary values can be added to multiple fields in a grid report if required.

Complete the Report Creation
Once the report has been completed click the save button and the report will be added to the list of reports in the selected category. Once the report has been saved the design layout can be modified by selecting the design layout button next to the report in the report category list. See below for details on the design layout.
Grouping, Sorting & Filtering Grid Reports on the Fly
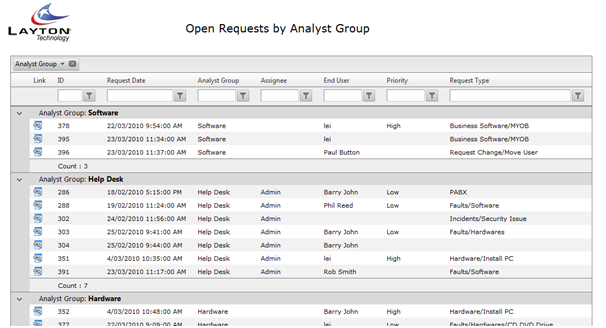
While Grid Reports can have pre-defined filtering and grouping settings this can also be done on the fly after a report has been generated.
To group by a particular field simply drag the column header into the section above and this will group by that column. If required you can create sub-groupings by dragging additional column headers into the grouping section. To undo a grouping click on the x button in the grouped by field or drag it back down with the other column headings.
Data can be sorted by clicking on the field column headers. Clicking once will sort the data in ascending order, a second click will sort in descending order and a third click will clear the sorting. Data can be filtered very quickly using the filter fields under each column header. Enter the required value in the desired filter field and click on the filter icon. This will then display the filter options available. To remove the filter click on the filter icon and select the NoFilter option at the top of the list.
Reports generated from the Request, Problem, Change and Action (Tasks) master tables will display a link field in the left hand column. The link field will display a Request, Problem, Change or Task icon depending on the type of report. This icon allows you to click through and view the details of an individual Request, Problem, Change or Task.