Layton ServiceDesk - Reporting - Creating Charts
![]() Previous article in this series: Creating Custom Reports
Previous article in this series: Creating Custom Reports
Contents |
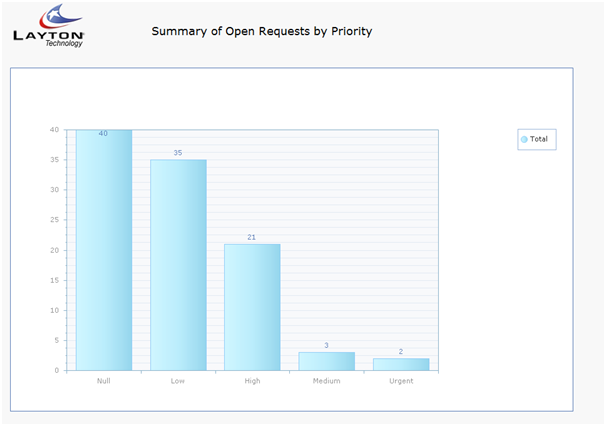
Creating a Pie or Column Chart
If a Pie or Column chart report type has been selected the “Available Fields” and “Selected Fields” windows will be removed as they are not applicable to these types of reports.
An additional option for the Pie and Column Charts will be to “Show Summary Grid”. A summary grid displays the same information that is represented in the Pie or Column chart in a grid format along with a grand total.
Select the Master Table from the drop down list. The drop down list will display all of the tables in the database. The most common reports will involve Requests, Problems, Changes & Tasks and the relevant master tables for these reports are listed below.
| Report On | Master Table to Select |
|---|---|
| Requests | Request |
| Problems | Problem |
| Changes | Change |
| Tasks | Action |
Select a “Grouped By” field from the drop down list. All of the data fields from the master table will be displayed in the drop down list.
The final step is to apply any filters to the report. Please see the Applying Filters section in the grid report section above.
Once the report has been completed click the save button and the report will be added to the list of reports in the selected category. After the report has been saved the design layout can be modified by selecting the design layout button next in the report category list. See below for details on the design layout.
Creating a Trend Chart
Select the Master Table from the drop down list. The drop down list will display all of the tables in the database. The most common reports will involve Requests, Problems, Changes & Tasks and the relevant master tables for these reports are listed below.
| Report On | Master Table to Select |
|---|---|
| Requests | Request |
| Problems | Problem |
| Changes | Change |
| Tasks | Action |
Unlike the Pie & Column charts the Trend Chart has a “No Grouping” option available for the Group By selection. If No Grouping is selected there will be a single trend line or bar based on the trend field.
As Trends are linear timelines the list of available trend fields are the date type fields within the master table. The most commonly used trend fields would be the Request Date (sys_requestdate), Problem Date (sys_problemdate) etc.
The Time Period is the interval been each data series and the options available are Day, Week, Month, Quarter and Year.
There are additional options to select whether the trend chart will be a Line or Bar chart and whether the orientation is vertical or horizontal.
The final step is to apply any filters to the report. Please see the Applying Filters section above in the grid report section.
Once the report has been completed click the save button and the report will be added to the list of reports in the selected category. After the report has been saved the design layout of the report can be modified by selecting the design layout button next to the report in the report category list. See below for details on the design layout.
