Layton ServiceDesk - Reporting - Overview
(Added overview, subsection headings) |
m (Changed title) |
||
| (9 intermediate revisions by one user not shown) | |||
| Line 1: | Line 1: | ||
| − | <p align="right">[[File:btn_back_up.png|link=User Guide for Layton | + | <p align="right">[[File:btn_back_up.png|link=User Guide for Layton ServiceDesk]] [[User Guide for Layton ServiceDesk|<u>Back to Contents</u>]]</p> |
=Overview= | =Overview= | ||
| − | Layton ServiceDesk includes a powerful reporting and analytics engine with the ability to create and customize your own reports | + | Layton ServiceDesk includes a powerful reporting and analytics engine with the ability to create and customize your own reports. |
Layton ServiceDesk includes over 100 predefined reports and charts out of the box. Each report provides ServiceDesk Analysts and Management with key data at their finger tips. While the canned reports will be more than adequate for most users, Layton ServiceDesk provides a powerful Report Builder tool which enables you to create any report you need using the intuitive report builder interface. You can very quickly create detailed data grid reports with Pie, Column and Line charts. A number of Trend charts are also include and you can create your own trend reports, which are particularly useful to spot spikes in your help desk data. | Layton ServiceDesk includes over 100 predefined reports and charts out of the box. Each report provides ServiceDesk Analysts and Management with key data at their finger tips. While the canned reports will be more than adequate for most users, Layton ServiceDesk provides a powerful Report Builder tool which enables you to create any report you need using the intuitive report builder interface. You can very quickly create detailed data grid reports with Pie, Column and Line charts. A number of Trend charts are also include and you can create your own trend reports, which are particularly useful to spot spikes in your help desk data. | ||
| − | This guide defines how to create, copy, modify, schedule and delete reports and also how to restore the system default reports that are supplied with the Layton ServiceDesk. All the Layton ServiceDesk Reports are stored as XML files in the | + | This guide defines how to create, copy, modify, schedule and delete reports and also how to restore the system default reports that are supplied with the Layton ServiceDesk. All the Layton ServiceDesk Reports are stored as XML files in the ''reports'' table in the Layton ServiceDesk database. |
| + | |||
| + | ==Export Options== | ||
| + | The type of report will determine the export options. | ||
| + | |||
| + | {| class="wikitable" border="1" | ||
| + | |-style="vertical-align:top;" | ||
| + | ! style="background:#009999; width: 150px; color: #FFFFFF"|Type | ||
| + | ! style="background:#009999; width: 50px; color: #FFFFFF"|[[File:Lsd btn export pdf.png|link=]] PDF | ||
| + | ! style="background:#009999; width: 50px; color: #FFFFFF"|[[File:Lsd btn export xls.png|link=]] XLS | ||
| + | ! style="background:#009999; width: 50px; color: #FFFFFF"|[[File:Lsd btn export csv.png|link=]] CSV | ||
| + | ! style="background:#009999; width: 700px; color: #FFFFFF"|Description | ||
| + | |-style="vertical-align:top;" | ||
| + | |Grid Report | ||
| + | |✔️ | ||
| + | |✔️ | ||
| + | |✔️ | ||
| + | |A simple list of records in a grid, e.g. ''Request Reports > All Requests by Site''. | ||
| + | |-style="vertical-align:top;" | ||
| + | |Chart Report | ||
| + | |✔️ | ||
| + | |❌ | ||
| + | |❌ | ||
| + | |A report containing a chart, e.g. ''Request Reports > Summary of Open Requests by Priority''. See '''[[Layton ServiceDesk - Reporting - Overview#Workaround|workaround]]''' below. | ||
| + | |-style="vertical-align:top;" | ||
| + | |Statistics Report | ||
| + | |❌ | ||
| + | |❌ | ||
| + | |❌ | ||
| + | |At this time, it is not possible to export Statistics reports. See '''[[Layton ServiceDesk - Reporting - Overview#Workaround|workaround]]''' below. | ||
| + | |} | ||
| + | |||
| + | ===Exporting Workaround=== | ||
| + | A workaround is to print the page as a PDF. | ||
| + | |||
| + | #Instead of clicking the name of a statistics report, right-click it and select ''Open in new tab''. | ||
| + | #The report configuration will open in a new tab. Click the tab to make it active. | ||
| + | #Enter the report parameters and click the ''Run Now'' button. | ||
| + | #Open the Print dialog. | ||
| + | #Change the Printer to ''Microsoft Print to PDF''. Print. | ||
=List of Included Reports= | =List of Included Reports= | ||
| Line 11: | Line 50: | ||
==Statistics== | ==Statistics== | ||
===Request Statistics by Analyst=== | ===Request Statistics by Analyst=== | ||
| − | This statistics report lists all the enabled Analysts and statistics based on SLAs configured in '''[[Layton | + | This statistics report lists all the enabled Analysts and statistics based on SLAs configured in '''[[Layton ServiceDesk - Settings - Libraries - Priority|Priorities]]'''. |
====Columns==== | ====Columns==== | ||
| Line 22: | Line 61: | ||
=====Re-Opened in Range===== | =====Re-Opened in Range===== | ||
| − | The number of Requests that were changed from a '''[[Layton | + | The number of Requests that were changed from a '''[[Layton ServiceDesk - Settings - Libraries - Request Statuses#Suspend|Suspend]]''' or '''[[Layton ServiceDesk - Settings - Libraries - Request Statuses#Closed|Closed]]''' status to a '''[[Layton ServiceDesk - Settings - Libraries - Request Statuses#Continue|Continue]]''' status within the date range specified. |
=====Closed in Range===== | =====Closed in Range===== | ||
| Line 28: | Line 67: | ||
=====Achieved Target===== | =====Achieved Target===== | ||
| − | The number of Requests that were resolved within the '''[[Layton | + | The number of Requests that were resolved within the '''[[Layton ServiceDesk - Settings - Libraries - Priority#Resolve Hours|Resolve Hours]]''' within the date range specified. |
=====Missed Target===== | =====Missed Target===== | ||
| − | The number of Requests that were not resolved within the '''[[Layton | + | The number of Requests that were not resolved within the '''[[Layton ServiceDesk - Settings - Libraries - Priority#Resolve Hours|Resolve Hours]]''' within the date range specified. |
=====No Target Set===== | =====No Target Set===== | ||
| Line 43: | Line 82: | ||
=====Average Durations===== | =====Average Durations===== | ||
| − | The display of the average duration is controlled by the setting '''[[Layton | + | The display of the average duration is controlled by the setting '''[[Layton ServiceDesk - General Settings - Request Settings#Statistics Duration Display|Statistics Duration Display]]''' in Administration > General Settings > Request Settings. The options are ''hours and minutes'' or ''decimal''. |
=====Avg Duration===== | =====Avg Duration===== | ||
| − | The average duration, in hours, that Requests were open, for the specified date range and filters. '''[[Layton | + | The average duration, in hours, that Requests were open, for the specified date range and filters. '''[[Layton ServiceDesk - General Settings - Default Working Hours|Default Working Hours]]''' and '''[[Layton ServiceDesk - General Settings - Default Closed Periods|closed periods]]''' are ignored. |
=====Avg Duration 24hr===== | =====Avg Duration 24hr===== | ||
| − | The average duration, in hours, that Requests were open, for the specified date range and filters. In this case, the duration is calculated based on 24 hours a day, ignoring '''[[Layton | + | The average duration, in hours, that Requests were open, for the specified date range and filters. In this case, the duration is calculated based on 24 hours a day, ignoring '''[[Layton ServiceDesk - General Settings - Default Working Hours|Default Working Hours]]''' and '''[[Layton ServiceDesk - General Settings - Default Closed Periods|closed periods]]'''. |
===All Requests First Resolution=== | ===All Requests First Resolution=== | ||
| − | ''First Resolution'' means the Request was resolved by the end of the first contact, with no comments from the Analyst. | + | ''First Resolution'' means the Request was resolved by the end of the first contact, with no comments from the Analyst. To count, the Request has to be closed within the specified period. A Request owned by an Analyst, but not assigned to that Analyst at the time of closure, does not count. |
Example: An End User phones the servicedesk, the Analyst opens a Request and closes it in the one session. | Example: An End User phones the servicedesk, the Analyst opens a Request and closes it in the one session. | ||
| − | The report lists all the Analyst Groups, starting with Requests not assigned to an Analyst Group. The ''Request Class'' menu can be used to select ''(All)'' Request Classes, or a specific one. | + | The report lists all the Analyst Groups, starting with Requests not assigned to an Analyst Group. The ''Request Class'' menu can be used to select ''(All)'' Request Classes, or a filter out a specific one. |
====Columns==== | ====Columns==== | ||
| + | [[File:Lsd report stat all req first res.png|center|link=]] | ||
=====Logged In Period===== | =====Logged In Period===== | ||
The quantity of Requests for each Analyst that were created within the specified date range. | The quantity of Requests for each Analyst that were created within the specified date range. | ||
=====Total Time Spent===== | =====Total Time Spent===== | ||
| + | The total time spent on first-resolution Requests. | ||
=====Average Time Spent===== | =====Average Time Spent===== | ||
| + | The average time spent on first-resolution Requests. | ||
=====Resolved on First Contact===== | =====Resolved on First Contact===== | ||
| + | The number of Requests resolved on first contact. | ||
=====% Resolved on First Contact===== | =====% Resolved on First Contact===== | ||
| + | The number of Requests resolved on first contact. | ||
==Request Reports== | ==Request Reports== | ||
| Line 83: | Line 127: | ||
==Custom Reports== | ==Custom Reports== | ||
| − | + | See '''[[Layton ServiceDesk - Reporting - Creating Custom Reports|Creating Custom Reports]]''' for details. | |
| − | <p align="right">[[Layton | + | <p align="right">[[Layton ServiceDesk - Reporting - Creating Custom Reports |<u>Next article in this series: ''Creating Custom Reports''</u>]] [[File:Btn forward.png|link=Layton ServiceDesk - Reporting - Creating Custom Reports]]</p> |
| − | <p align="right">[[File:btn_back_up.png|link=User Guide for Layton | + | <p align="right">[[File:btn_back_up.png|link=User Guide for Layton ServiceDesk]] [[User Guide for Layton ServiceDesk|<u>Back to Contents</u>]]</p> |
Latest revision as of 04:47, 21 May 2020
[edit] Overview
Layton ServiceDesk includes a powerful reporting and analytics engine with the ability to create and customize your own reports.
Layton ServiceDesk includes over 100 predefined reports and charts out of the box. Each report provides ServiceDesk Analysts and Management with key data at their finger tips. While the canned reports will be more than adequate for most users, Layton ServiceDesk provides a powerful Report Builder tool which enables you to create any report you need using the intuitive report builder interface. You can very quickly create detailed data grid reports with Pie, Column and Line charts. A number of Trend charts are also include and you can create your own trend reports, which are particularly useful to spot spikes in your help desk data.
This guide defines how to create, copy, modify, schedule and delete reports and also how to restore the system default reports that are supplied with the Layton ServiceDesk. All the Layton ServiceDesk Reports are stored as XML files in the reports table in the Layton ServiceDesk database.
[edit] Export Options
The type of report will determine the export options.
| Type | Description | |||
|---|---|---|---|---|
| Grid Report | ✔️ | ✔️ | ✔️ | A simple list of records in a grid, e.g. Request Reports > All Requests by Site. |
| Chart Report | ✔️ | ❌ | ❌ | A report containing a chart, e.g. Request Reports > Summary of Open Requests by Priority. See workaround below. |
| Statistics Report | ❌ | ❌ | ❌ | At this time, it is not possible to export Statistics reports. See workaround below. |
[edit] Exporting Workaround
A workaround is to print the page as a PDF.
- Instead of clicking the name of a statistics report, right-click it and select Open in new tab.
- The report configuration will open in a new tab. Click the tab to make it active.
- Enter the report parameters and click the Run Now button.
- Open the Print dialog.
- Change the Printer to Microsoft Print to PDF. Print.
[edit] List of Included Reports
[edit] Statistics
[edit] Request Statistics by Analyst
This statistics report lists all the enabled Analysts and statistics based on SLAs configured in Priorities.
[edit] Columns
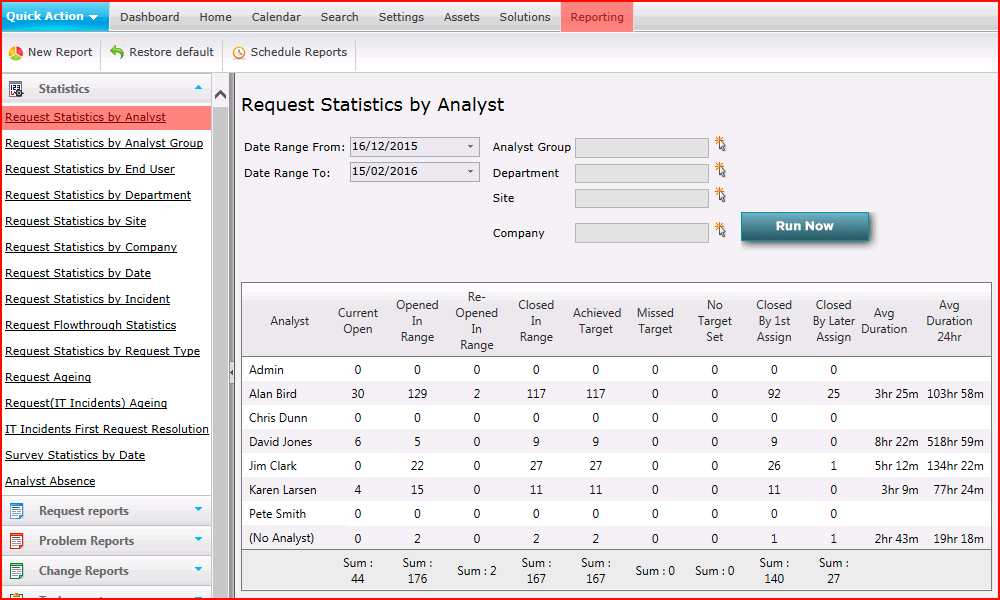
[edit] Current Open
The number of Requests that are currently open within the date range specified.
[edit] Opened in Range
The number of Requests that were opened within the date range specified.
[edit] Re-Opened in Range
The number of Requests that were changed from a Suspend or Closed status to a Continue status within the date range specified.
[edit] Closed in Range
The number of Requests that were closed within the date range specified.
[edit] Achieved Target
The number of Requests that were resolved within the Resolve Hours within the date range specified.
[edit] Missed Target
The number of Requests that were not resolved within the Resolve Hours within the date range specified.
[edit] No Target Set
The number of Requests that were not assigned a Priority, or were assigned a Priority without a configured SLA, within the date range specified.
[edit] Closed By 1st Assign
The number of Requests that were closed by the first Analyst assigned within the date range specified. This can be via manual assignment by an Analyst manually creating a Request and assigning it to themselves or a different Analyst, or via auto-assignment. The key is that the Request was only assigned to one Analyst, then closed.
[edit] Closed By Later Assign
The number of Requests that were closed by an Analyst other than the first Analyst assigned within the date range specified. This means that more than one Analyst was assigned to the Request, e.g. in a two-tier support system, First-Level Support was unable to resolve the Request and assigned it to Second-Level Support.
[edit] Average Durations
The display of the average duration is controlled by the setting Statistics Duration Display in Administration > General Settings > Request Settings. The options are hours and minutes or decimal.
[edit] Avg Duration
The average duration, in hours, that Requests were open, for the specified date range and filters. Default Working Hours and closed periods are ignored.
[edit] Avg Duration 24hr
The average duration, in hours, that Requests were open, for the specified date range and filters. In this case, the duration is calculated based on 24 hours a day, ignoring Default Working Hours and closed periods.
[edit] All Requests First Resolution
First Resolution means the Request was resolved by the end of the first contact, with no comments from the Analyst. To count, the Request has to be closed within the specified period. A Request owned by an Analyst, but not assigned to that Analyst at the time of closure, does not count.
Example: An End User phones the servicedesk, the Analyst opens a Request and closes it in the one session.
The report lists all the Analyst Groups, starting with Requests not assigned to an Analyst Group. The Request Class menu can be used to select (All) Request Classes, or a filter out a specific one.
[edit] Columns
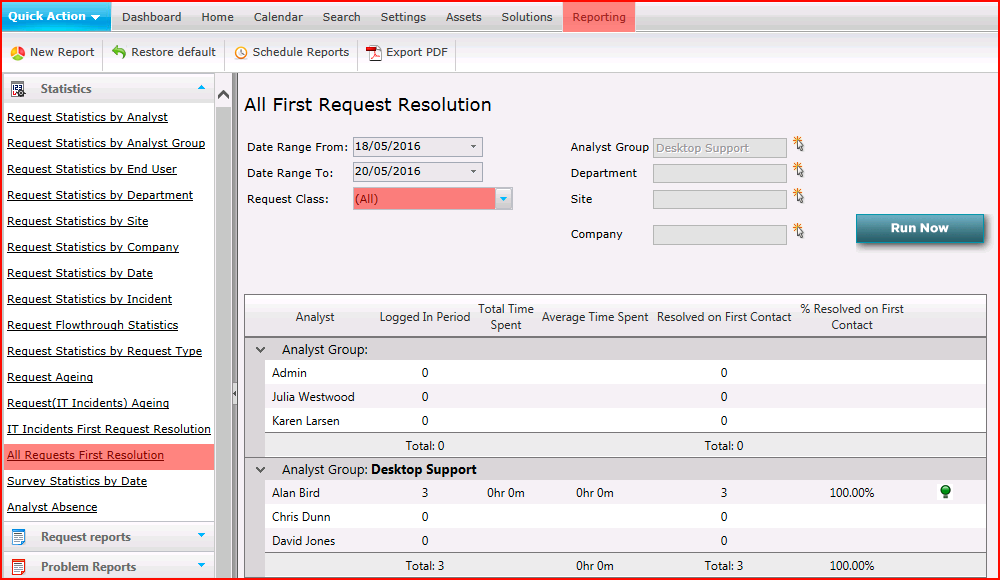
[edit] Logged In Period
The quantity of Requests for each Analyst that were created within the specified date range.
[edit] Total Time Spent
The total time spent on first-resolution Requests.
[edit] Average Time Spent
The average time spent on first-resolution Requests.
[edit] Resolved on First Contact
The number of Requests resolved on first contact.
[edit] % Resolved on First Contact
The number of Requests resolved on first contact.
[edit] Request Reports
[edit] Problem Reports
[edit] Change Reports
[edit] Task Reports
[edit] Priority/SLA Reports
[edit] Miscellaneous Reports
[edit] Custom Reports
See Creating Custom Reports for details.