Layton ServiceDesk - Reporting - Overview
m (Implemented new "Next Article" link) |
(Expanded section) |
||
| Line 10: | Line 10: | ||
===Statistics=== | ===Statistics=== | ||
| + | ====Request Statistics by Analyst==== | ||
| + | This statistics report lists all the enabled Analysts and statistics based on SLAs configured in '''[[Layton ServiceDesk™ - Settings - Libraries - Priority|Priorities]]'''. | ||
| + | |||
| + | =====Avg Duration===== | ||
| + | The average duration, in hours, that Requests were open, for the specified date range and filters. '''[[Layton ServiceDesk™ - General Settings - Default Working Hours|Default Working Hours]]''' and '''[[Layton ServiceDesk™ - General Settings - Default Closed Periods|closed periods]]''' are ignored. | ||
| + | |||
| + | =====Avg Duration 24hr===== | ||
| + | The average duration, in hours, that Requests were open, for the specified date range and filters. In this case, the duration is calculated based on 24 hours a day, ignoring '''[[Layton ServiceDesk™ - General Settings - Default Working Hours|Default Working Hours]]''' and '''[[Layton ServiceDesk™ - General Settings - Default Closed Periods|closed periods]]'''. | ||
| + | |||
| + | |||
| + | [[File:Lsd reporting statistics 01.png|center|link=]] | ||
===Request Reports=== | ===Request Reports=== | ||
Revision as of 00:32, 16 February 2016
Contents |
Overview
Layton ServiceDesk includes a powerful reporting and analytics engine with the ability to create and customize your own reports, including the ability to export to CSV, XLS and PDF.
Layton ServiceDesk includes over 100 predefined reports and charts out of the box. Each report provides ServiceDesk Analysts and Management with key data at their finger tips. While the canned reports will be more than adequate for most users, Layton ServiceDesk provides a powerful Report Builder tool which enables you to create any report you need using the intuitive report builder interface. You can very quickly create detailed data grid reports with Pie, Column and Line charts. A number of Trend charts are also include and you can create your own trend reports, which are particularly useful to spot spikes in your help desk data.
This guide defines how to create, copy, modify, schedule and delete reports and also how to restore the system default reports that are supplied with the Layton ServiceDesk. All the Layton ServiceDesk Reports are stored as XML files in the Reports table in the Layton ServiceDesk database.
List of Included Reports
Statistics
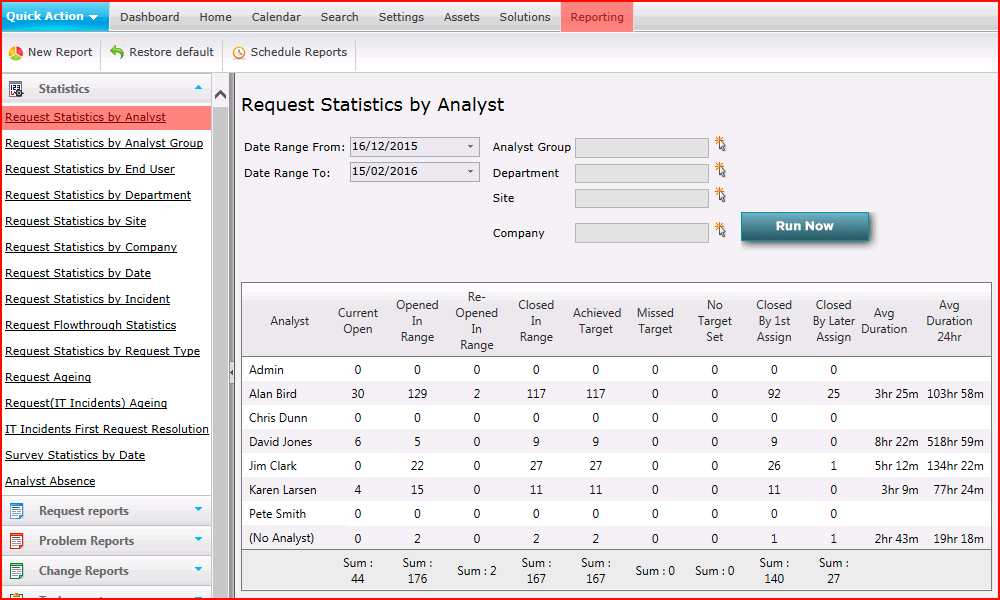
Request Statistics by Analyst
This statistics report lists all the enabled Analysts and statistics based on SLAs configured in Priorities.
Avg Duration
The average duration, in hours, that Requests were open, for the specified date range and filters. Default Working Hours and closed periods are ignored.
Avg Duration 24hr
The average duration, in hours, that Requests were open, for the specified date range and filters. In this case, the duration is calculated based on 24 hours a day, ignoring Default Working Hours and closed periods.