AuditWizard - Using AuditWizard - Dashboard
Contents |
Overview
The Dashboard tab acts as an overview of the current auditing status within AuditWizard and also serves to guide you through the process of discovering the hardware and software installed on your networked computers and reconciling this information with your own internal lists of software and hardware purchased.

The left-hand pane gives summary information and indicates whether the AuditWizard Service is running or not. The right-hand pane is split into four sections, listed here in clockwise order:
- Software Compliance: Overall Software Compliance, Over-Licensed Applications or Under-Licensed Applications can be displayed. Clicking a bar in the bar chart will display a grid view of those assets that apply to that label.
- Server Disk Space: Any server can be selected here to view an overview of the space in use on their drives.
- Asset Inventory: Clicking the various tabs changes the pie chart to indicate ratios of classes of device.
- Live Application News Feed: A running list of events that have occurred, e.g. a new asset added to the database, drive space falling below a certain amount, etc.
Ribbon Commands
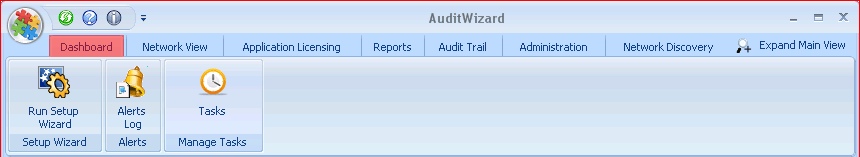
Setup Wizard
Run Setup Wizard
Opens the Setup Wizard.
Alerts
Alerts Log
Opens the log that displays alerts generated by the Scanner.
Manage Tasks
Tasks
Opens the Tasks dialog.
Overview Pane
The left-hand pane lists a number of statistics.
Asset Statistics
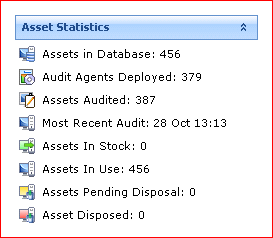
Agents in Database: Total number of assets, whether audited, discovered but not audited, or manually created.
Audit Agents Deployed: The number of Agent services that have been installed on computers.
Assets Audited: Total number of assets that have returned an audit file that has been processed.
Most Recent Audit: The date that the last uploaded audit was done, in Day, Month, Time format.
Assets in Stock: Total number of assets that are not in use but held in reserve (not disposed).
Assets in Use: Total number of assets being used.
Assets Pending Disposal: Total number of assets still in possession but not yet disposed.
Assets Disposed: Total number of assets disposed.
Audit History
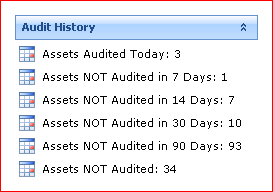
Assets Audited Today: Number of assets audited today.
Assets NOT Audited in 7 Days: Number of previously audited assets that have not been audited within a 7-day time frame.
Assets NOT Audited in 14 Days: Number of previously audited assets that have not been audited within a 14-day time frame.
Assets NOT Audited in 30 Days: Number of previously audited assets that have not been audited within a 30-day time frame.
Assets NOT Audited in 90 Days: Number of previously audited assets that have not been audited within a 90-day time frame.
Assets NOT Audited: Total number of computer assets that have been discovered but not yet audited.
Alerts
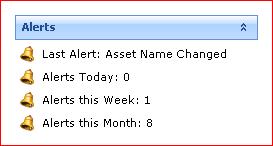
Last Alert: The last alert that was generated.
Alerts Today: The number of alerts generated today.
Alerts this Week: The number of alerts generated in the last week.
Alerts this Month: The number of alerts generated in the last month.
Support Contracts
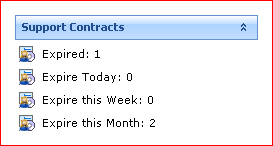
Expired: Number of support contracts expired, in total.
Expire Today: Number of support contracts due to expire today.
Expire this Week: Number of support contracts due to expire this week.
Expire this Month: Number of support contracts due to expire this month.
AuditWizard Licensing
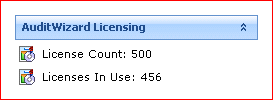
License Count: Total number of AuditWizard licences purchased. This covers only those assets which have an operating system, i.e. computers and not manually entered assets such as monitors, switches, etc.
Licenses In Use: Number of AuditWizard licences used by computer assets.
Service Status
Indicates whether the AuditWizard Service is running or not. Click the status message to open the AuditWizard Service Control dialog.
Dashboard View
Application Graph
The top-left graph relates to software. By default, the graph displayed is Overall Software Compliance. Clicking any graph section "burrows down" to a grid view that the graph represents. There are three options:
- Overall Software Compliance: Outlines the number of applications that are complaint, non-compliant, ignored or not defined. You can use this graph to check the levels of each and even to determine how many applications you need to process as licensed or ignored.
- Over-Licensed Applications: Applications that have more licences owned than are deployed.
- Under-Licensed Applications: Applications that have less licences owned than are deployed.
Server Disk Space
The top-right graph lists all the computers that are servers and the disk space in use on each drive. You can select any server from the list to view its disk space usage.
Asset Inventory
The lower-left graph shows the breakdown in percentage of various types of assets. The various tabs cover major asset-type categories. The graph can be filtered based on location using the menu.
Live Application News Feed
The lower-right pane lists various events pertinent to the application such as when an asset is added, when installation count exceeds licence count, when a new version of the application is available, etc. The Date and Item columns can be filtered in various ways.